
Graphing Linear Functions in Standard Form
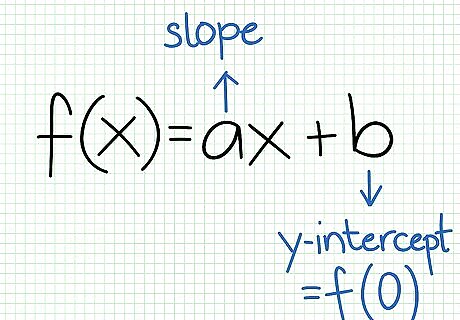
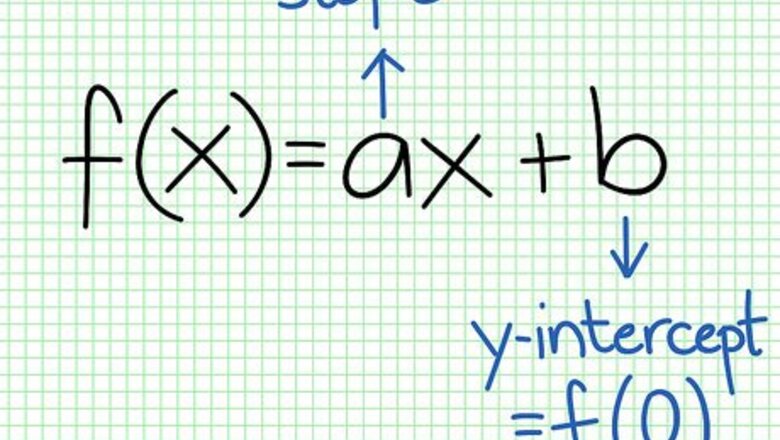
Recognize the standard form of a linear function. Linear functions are typically written in the form f(x) = ax + b. The a represents the gradient of the line, which gives the rate of change of the dependent variable. This is also known as the “slope.” The b represents the y-axis intercept. It is the value of the dependent variable y or, in other words, f(x) when x = 0. Say, for example, that you have a function f(x) = x + 5. This is a linear function in standard form.Do Linear Functions Step 1Bullet1 Version 2.jpg
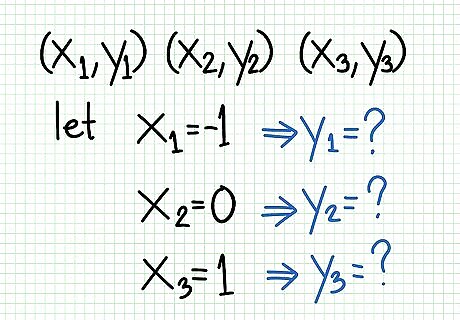
Find at least two points. You know your graph will be a straight line because you have a linear function; therefore, you really need only two points. In general, though, you should find three points instead, to check for accuracy. In the example above, you might choose to use -1, 0, and 1 for your x values. Solve as shown.Do Linear Functions Step 2Bullet1 Version 2.jpg
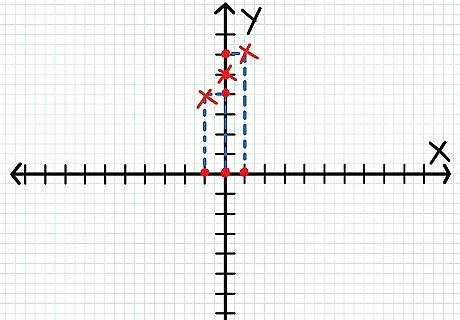
Plot the points. Plot your points on the coordinate system, using the values you got from solving your three equations. In the example above, your graph would look like this.Do Linear Functions Step 3Bullet1 Version 2.jpg
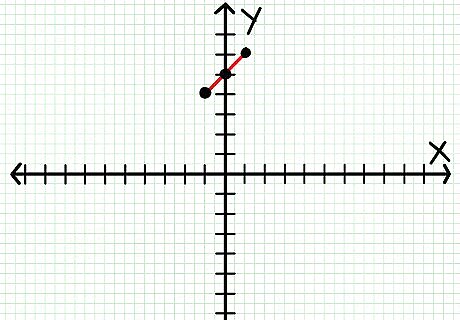
Connect the points. For any two points, there is only one way to connect them with a straight line. Use a ruler to join them with a straight line. Note that if you graph three points, and they don’t all lie on the same line, then you’ve made a mistake somewhere. Go back and calculate again. In the example above, your graph would look like this.Do Linear Functions Step 4Bullet1 Version 2.jpg
Graphing Linear Functions in Non-Standard Form
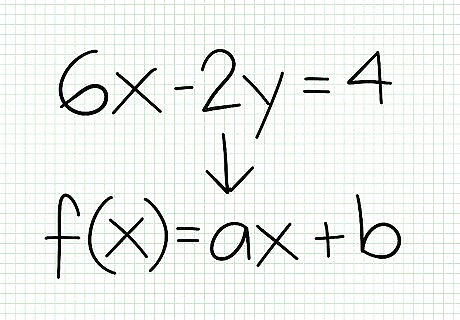
Rearrange the function to make y the subject. If you have a linear function that’s not in the standard form, you’ll need to rewrite it before you can make a graph. Say you have the function 6x – 2y = 4. Move everything but y to the left, as follows.Do Linear Functions Step 5Bullet1 Version 2.jpg Then divide both sides by -2. You now have the standard form of a linear function: y = 3x – 2.Do Linear Functions Step 5Bullet2 Version 2.jpg
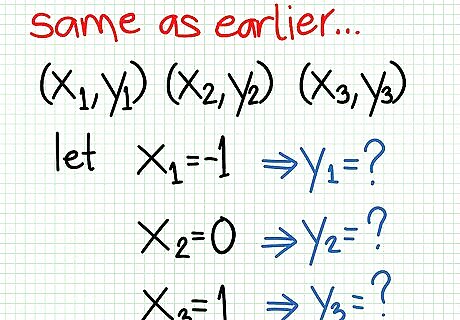
Find at least two points. You know your graph will be a straight line because you have a linear function; therefore, you really need only two points. In general, though, you should find three points instead, to check for accuracy. In the rewritten example above, you might choose to use -1, 0, and 1 as your x values. Solve as follows.Do Linear Functions Step 6Bullet1 Version 2.jpg
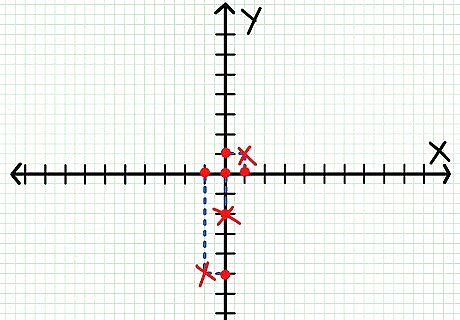
Plot the points. Plot your points on the coordinate system, using the values you got from solving your three equations. In the example above, your points would look like this.Do Linear Functions Step 7Bullet1 Version 2.jpg
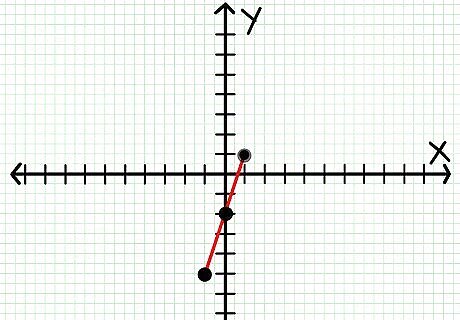
Connect the points. For any two points, there is only one way to connect them with a straight line. Use a ruler to join them with a straight line. Note that if you graph three points, and they don’t all lie on the same line, then you’ve made a mistake somewhere. Go back and calculate again. In the example above, your graph would look like this.Do Linear Functions Step 8Bullet1 Version 2.jpg


Comments
0 comment