
views
Determining Safety Stock from Demand

Look to historic demand and demand variability to determine how to avoid stockouts. The following calculations will predict the stock necessary to achieve a certain cycle service level - i.e. the percentage of supply cycles that will result in a stockout.
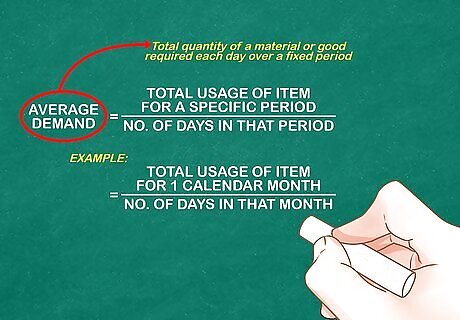
Determine average demand. Average demand is the total quantity of a material or goods required each day over a fixed period. A common approach is to check the total usage of that item for a specified period, such as one calendar month or the interval between ordering and delivery of stock, and then divide by the days in that month to find usage per day. For many items — such as long-established brands in a grocery store — historical demand will provide the best guide to calculating demand.
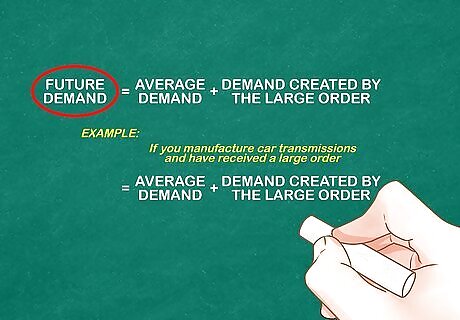
Consider future demand for particular stock items. Sometimes it makes more sense to consider future demand. For instance, if you manufacture car transmissions and have received a large order, you will want to factor that order into demand. In this case, you might consider calculating average demand and then adding in the demand created by the large order.
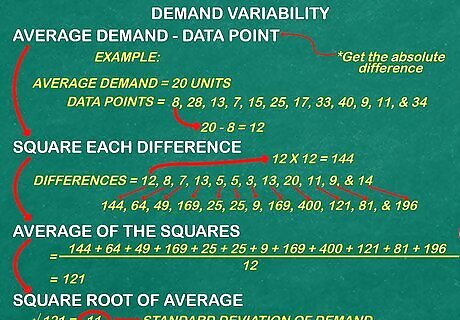
Calculate demand variability. Average demand can only tell you so much. If demand fluctuates dramatically from month to month or day to day, you will need to include that in your calculations so that you will have enough stock to cover surges in demand. Start by using a spreadsheet to calculate the standard deviation in demand (in Excel, enter all demand figures in their own cells, then the formula is = STDEV(the cells in question)). Or use the following formula: Start with the average demand over a period of time (i.e. a week, month or year). For our example, let's say it is 20 units per month. Determine the absolute difference between each data point and the average. For example, if monthly demand was 8, 28, 13, 7, 15, 25, 17, 33, 40, 9, 11, and 34 units, the differences from 20 would be: 12, 8, 7, 13, 5, 5, 3, 13, 20, 11, 9, and 14. Square each difference. In our example, this would yield: 144, 64, 49, 169, 25, 25, 9, 169, 400, 121, 81, and 196. Calculate the average of the squares. E.g. 121 Take the square root of the average. This is your standard deviation of demand. E.g. 11
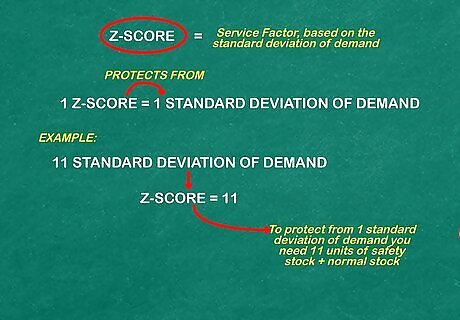
Determine your service factors, aka Z-scores. The service factor, or Z-score, is based on the standard deviation of demand. A Z-score of 1 will protect you from 1 standard deviation of demand. So in our example, since the standard deviation of demand was 11, it would take 11 units of safety stock in addition to normal stock to protect against one standard deviation, yielding a Z-score of 1. 22 units of safety stock would yield a Z-score of 2.
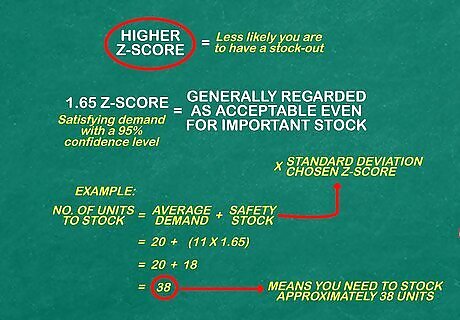
Decide on the Z-score you are looking for. The higher your Z-score, the less likely you are to have a stock-out. In choosing a Z-score, you will want to balance customer service and inventory cost. You will want a higher Z-score for stocked units with greater value to your business. A Z-score of 1.65, satisfying demand with a 95% confidence level, is generally regarded as acceptable even for important stock. In this case, that would mean stocking approximately 18 units (the standard deviation of 11 x 1.65) of safety stock, or 38 units total (average demand + safety stock). Here are how Z-scores relate to the probability you can fulfill demand: Z-Score of 1 = 84% Z-Score of 1.28 = 90% Z-Score of 1.65 = 95% Z-Score of 2.33 = 99%
Accounting for Lead Time
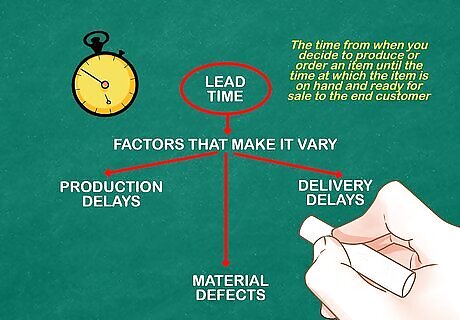
Factor in lead time to account for supply variability. The lead time is the time from when you decide to produce or order an item until the time at which the item is on hand and ready for sale to the end customer. There are several factors that can cause lead time to vary: Production delays — If your own production process is variable, this may impact the lead time. In addition, the production process of the products you are ordering may vary. Material defects — If you order 10 units and 2 are defective, you will have to wait for the additional 2 units. Delivery delays — Shipping times can be expected to vary slightly at the best of times, and unexpected events like natural disasters or strikes can further delay delivery.
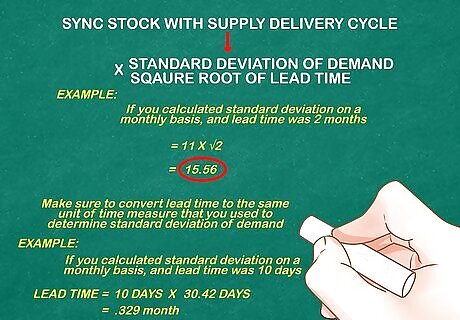
Sync your stock with your supply delivery cycle. To do so, you will need to adjust your standard deviation of demand to match the lead time period. Multiply your standard deviation of demand (calculated in Part I, step 4) by the square root of the lead time. This means if you calculated standard deviation on a monthly basis, and lead time was 2 months, you would multiply the standard deviation by the square root of two. Using our previous example, this means: 11 x √2 = 15.56. Make sure to convert lead time to the same unit of time measure that you used to determine standard deviation of demand. For example, if you calculated standard deviation on a monthly basis and lead time was 10 days, you would want to convert lead time to .329 months — i.e. 10 divided by 30.42 (the average days in a month).
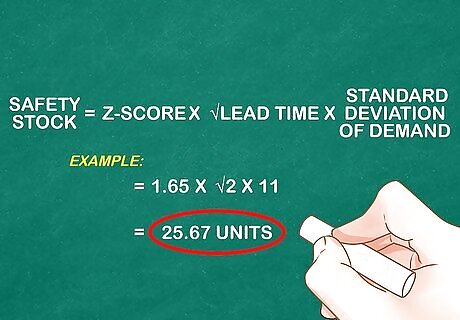
Put it all together. We can combine formulas to determine safety stock based on demand with lead time factored in as follows: Safety stock = Z-score x √lead time x standard deviation of demand In our example, to avoid stockouts 95% of the time, you would thus need 1.65 (the Z-score) x √2 (lead time) x 11 (standard deviation of demand) = 25.67 units of safety stock.
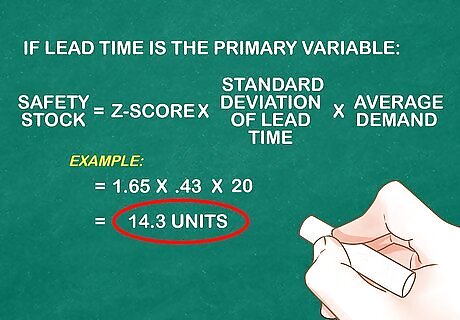
Calculate safety stock differently if lead time is the primary variable. If demand is constant but lead time variable, then you will need to calculate safety stock using the standard deviation of lead time. In this case, the formula will be: Safety stock = Z-score x standard deviation of lead time x average demand For example, if aiming for a Z-score of 1.65, with average demand constant at 20 units per month, and lead times over a six month period being 2, 1.5, 2.3, 1.9, 2.1, and 2.8 months, then Safety Stock = 1.65 x .43 x 20 = 14.3 units.
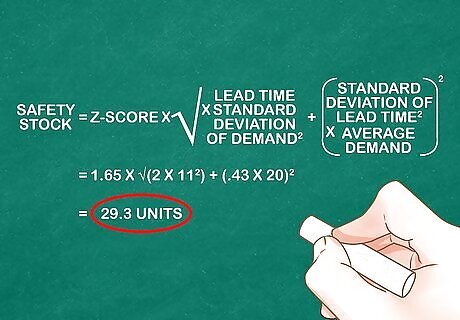
Use a third equation to account for independent variation in both lead time and demand. If lead time and demand vary independently of one another (i.e. the factors leading to variance are different for each), then safety stock is the Z-score multiplied by the square root of the sum of the squares of demand and supply variability, or: Safety stock = Z-score x √[(lead time x standard deviation of demand squared) + (standard deviation of lead time squared x average demand squared)] In our example: safety stock = 1.65 x √[(2 x 11squared) + (.43 x 20)squared] = 29.3 units.
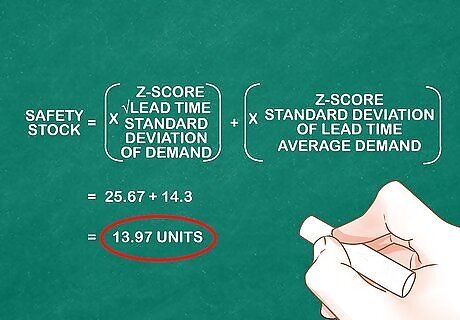
Sum the calculations based on lead time and demand variability if the two factors vary dependently. That is, if the same factors impact lead time and demand variability, you will need to sum the individual safety stock calculations in order to assure yourself of adequate safety stock. In this case: Safety stock = (Z-score x √lead time x standard deviation of demand) + (Z-score x standard deviation of lead time x average demand) In our example: safety stock = 25.67 + 14.3 = 39.97 units.
Reducing the Need for Safety Stock
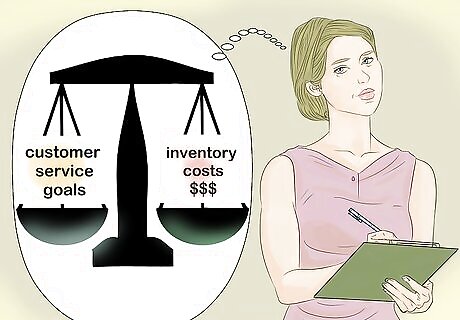
Reduce the amount of safety stock you need to save money. Having too much stock on hand will increase inventory costs, so it is ideal to run a lean supply chain. Remember: the goal is not to prevent all stockouts, but to balance customer service goals and inventory costs.

Monitor your use of safety stock. Is the model performing as expected? If so, you should be using safety stock in about half of your supply cycles. If you are using safety stock less, you may be able to cut back on how much you hold.

Decrease variability in demand. Demand tends to vary more than lead time and has a much greater impact on the safety stock equation. Smoothing out demand variability will allow you to hold less safety stock. Demand can be shaped through adjusting price, lead time, or the content of the products being produced.

Work to reduce lead time. If lead time were zero, then you would need no safety stock, as product could be produced instantly upon demand. Of course, lead time can never be reduced to zero, but lowering it as much as possible is the best way to run a leaner business. This means both tightening your supply chains and your production processes.

Shift customer service targets. If a high level of customer service is not required — i.e. stockouts will not cause your business to lose customers — then you can adjust your Z-score downward to lower the amount of safety stock you need on hand.

Implement an order-expediting process. This process allows you to more rapidly produce or deliver goods in order to prevent stockouts. As a result, your company will not need to carry as much safety stock, which is particularly helpful when the stock in question costs a lot to produce, and thus costs more to carry in inventory.
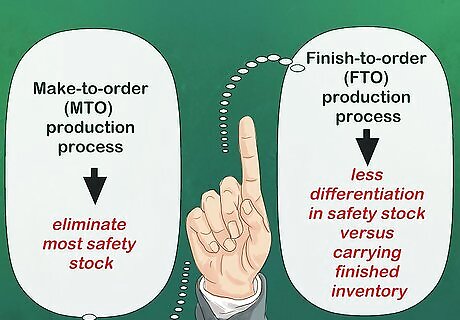
Consider shifting to a make-to-order (MTO) or finish-to-order (FTO) production process. If your customers are willing to accept longer lead times, which is often the case for things they do not purchase regularly, then MTO will allow you to eliminate most safety stock, while FTO will allow for less differentiation in safety stock versus carrying finished inventory.


Comments
0 comment