views
“If you can’t measure it, you can’t improve it.” This oft-cited quote is attributed to Lord Kelvin or William Thomson, who also theorised a completely new temperature scale. Similarly, management professor Peter Drucker has said something similar: “What can’t be measured, can’t be managed.” The same holds true in the case of public policy too. Any informed policy should be driven by data. Poverty measurement is no exception. It helps in getting an understanding of levels of deprivation. Poverty analyses are essential primarily for three reasons: (1) To identify poverty levels in the country; (2) to arrive at the reasons for poverty in the geographical region; and (3) to inform policy. Regular poverty measurement also helps in gauging the effectiveness of development strategy.
For estimating poverty, it is important to have a poverty line and accurate data on consumption expenditure. As far as the first one is concerned, India follows the poverty line by the Tendulkar Committee. The poverty line has been disaggregated state-wise and separately for rural and urban areas. As for accurate data on consumption expenditure, the best way is to rely on NSS’ Household Consumption Expenditure Survey (HCES). It is a comprehensive survey that seeks information on more than 300 items such as clothing, education, fuel, rent, transportation, durable goods, etc. It allows one to get insights into the demographic, nutritional and labour-force characteristics of poverty groups. Currently, we have data from HCES conducted in 2011-12. Hence, the poverty estimates based on the Tendulkar Methodology are also from 2011-12.
Without a consumer expenditure survey, one has to rely on the next best alternative to arrive at poverty estimates for the country. In this case, it is the Periodic Labour Force Survey (PLFS) 2020-21. One inevitable response would be that PLFS cannot be used to arrive at poverty estimates. That might have been the case if one relied on previous PLFS rounds to arrive at poverty estimates. In previous PLFS rounds, only one question was administered to collect data on participants’ consumption expenditure. In PLFS 2020-21, however, there were five different questions on consumption expenditure. These include information on (a) goods and services; (b) homegrown produce; (c) in-kind transfers and gifts; (d) expenditure on clothing, footwear, etc; and (e) expenditure on durable goods. The value of something like free grains or other in-kind transfers is imputed based on the response of the participant. Thus, PLFS 2020-21 is better equipped as compared to PLFS rounds to mimic a household consumer expenditure survey.
Furthermore, another peculiar thing about PLFS 2020-21 is that it was undertaken right in the middle of the pandemic, i.e., from July 2020 to June 2021. As a result, it takes into account the impact of both the first and second waves of the Covid-19 pandemic. It also considers the impact of reverse migration from urban areas to rural areas during the first wave of the pandemic. Since the economy has recovered after 2020-21, there would have been a further reduction in poverty in the current financial year.
PLFS 2020-21 was undertaken right in the middle of the pandemic, i.e., from July 2020 to June 2021. As a result, it takes into account the impact of both the first and second waves of the Covid-19 pandemic. It also takes into account the impact of reverse migration from urban areas to rural areas during the first wave of the pandemic. The population which is just above the poverty line and vulnerable to risks and events is susceptible to going below the poverty line during a crisis or shock. Once the economy recovers, those just below the poverty line again go above the poverty line. Thus, as the economy has recovered after 2020-21, poverty will have further reduced in the current financial year.
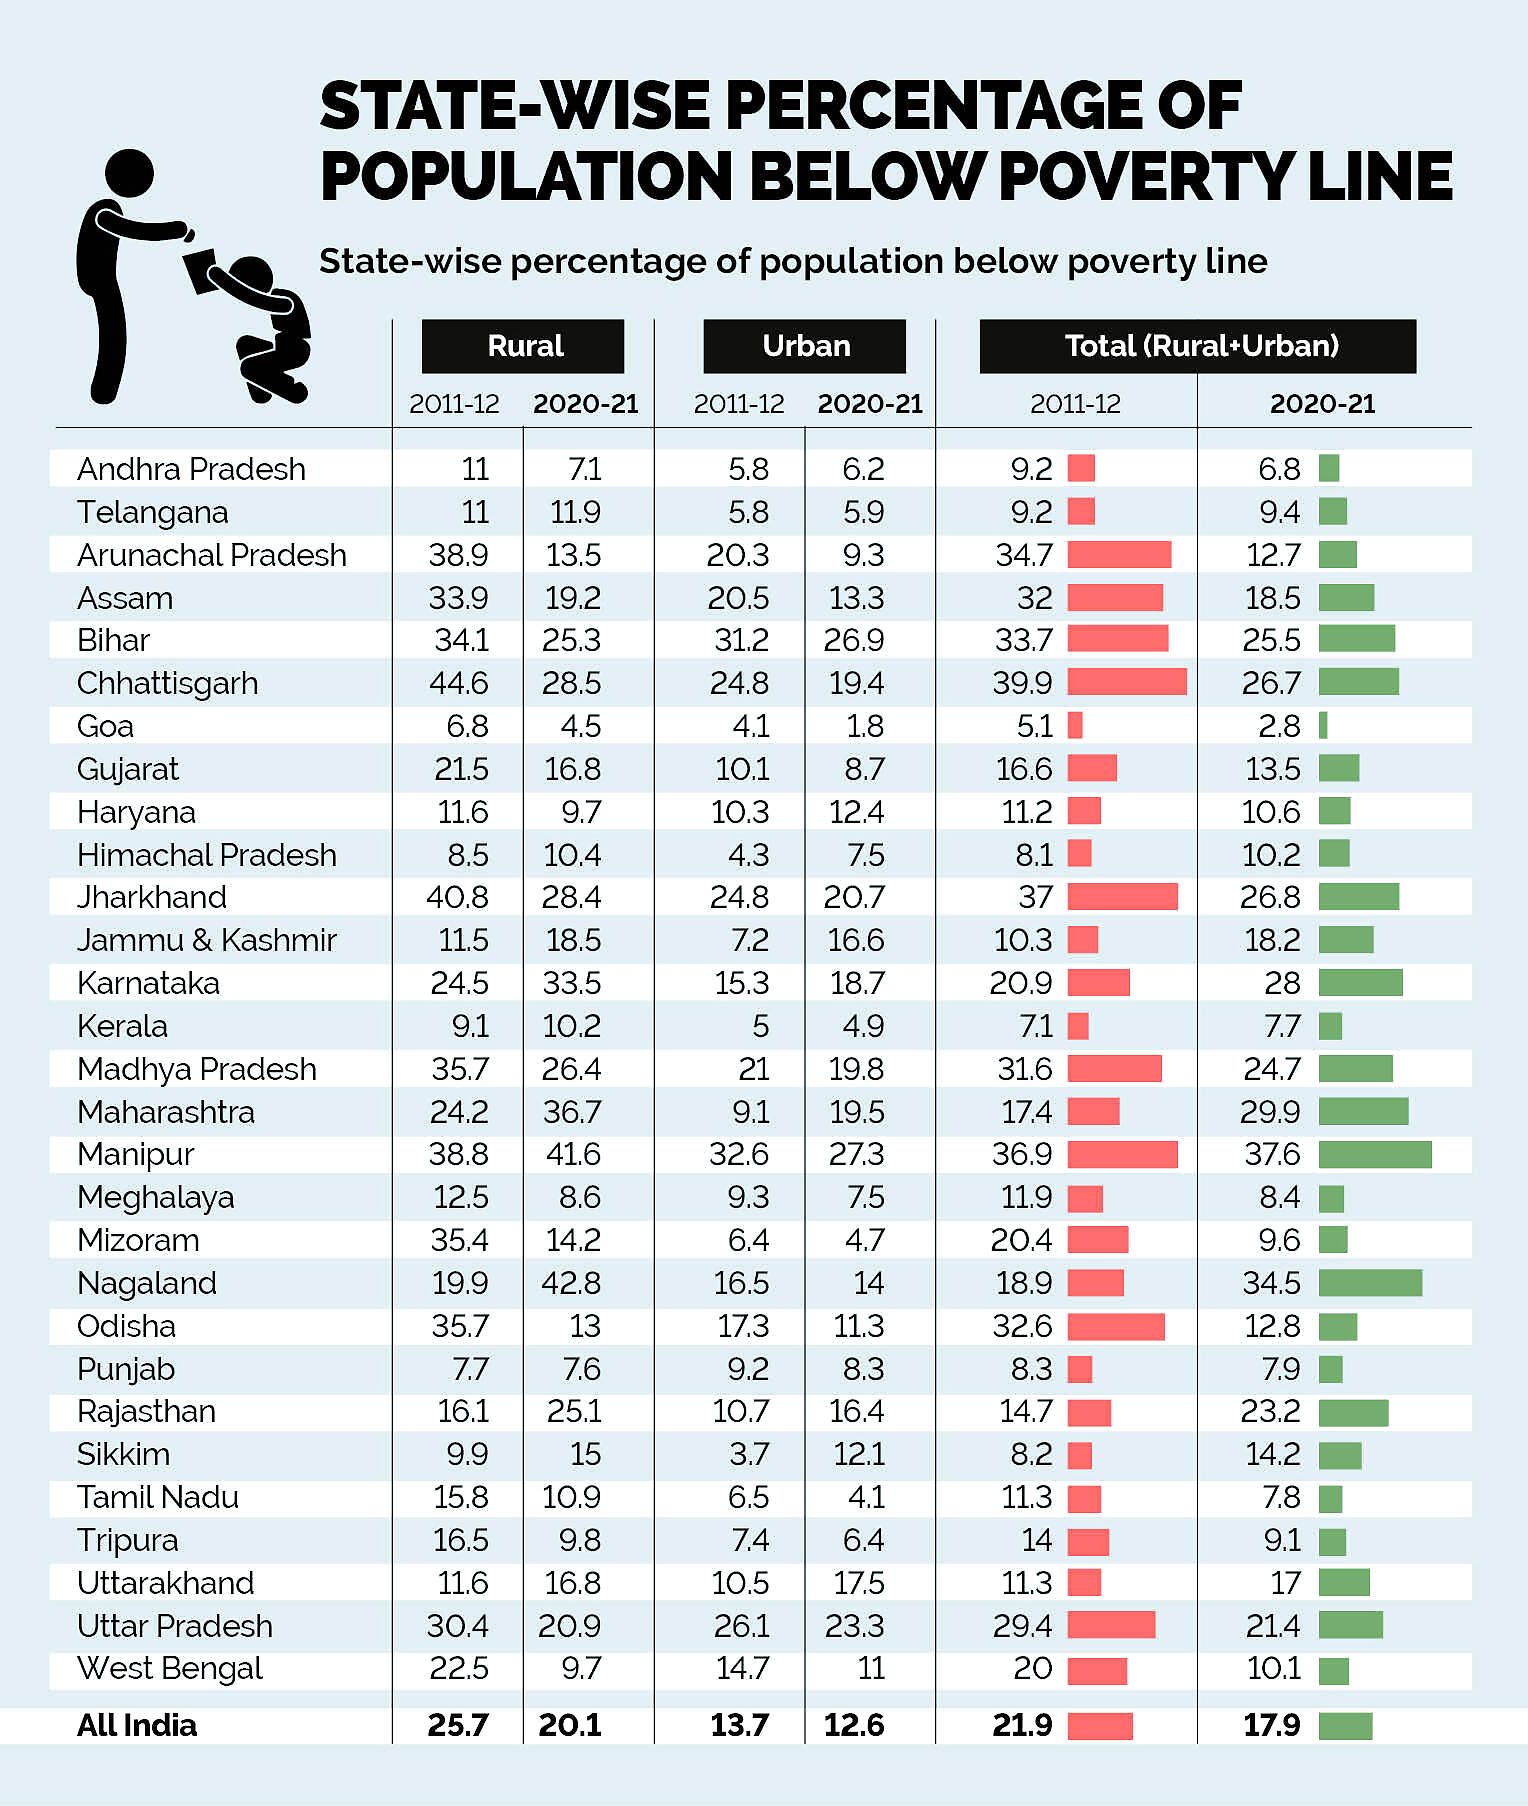
Thus, we have used PLFS 2020-21 to arrive at all-India and state-wise poverty estimates. We have also used the Consumer Price Index (CPI) for price changes since 2011-12 to arrive at corresponding poverty lines for 2020-21. If one looks at all-India numbers, the poverty in India has reduced from 21.9% in 2011-12 to 17.9% in 2020-21. While the reduction is significant, it is not commensurate. The reduction was curtailed due to the pandemic. Poverty reduction would have been more pronounced had the survey been conducted in a normal year.
Among the large states, the highest levels of the population above the poverty line reside in Maharashtra (29.6%), Karnataka (28%), Chhattisgarh (26.7%), Bihar (25.5) and Jharkhand (26.8%). There are also the states which have seen a significant increase in poverty. Again, if one excludes the small states (because the sample size is also small in these states), poverty has increased in Maharashtra (by 12.5%), Rajasthan (8.5%) Jammu & Kashmir (7.8%), Karnataka (7.1%), and Uttarakhand (5.7%). Since some of these states are also densely populated, increasing poverty levels is concerning. Apart from the intervention by the Union government, the state governments will also have to do their share of work towards poverty alleviation. They should look at the steps taken by other states toward poverty reduction. It is commendable that in Arunachal Pradesh (-22%), Odisha (-19.8%), Assam (-13.5%). Chhattisgarh (-13.2%), Mizoram (-10.8%), Jharkhand (-10.1%), West Bengal (-9.9%) and Uttar Pradesh (-8.1%) poverty has reduced significantly in the last 9 years.
In one of the most cited essays on poverty, Lipton and Ravallion note: “The highest incidence and severity of poverty are found in rural areas, especially if ill-watered. Concerns about the ‘urbanisation of poverty’ in LDCs are sometimes overstated. While the proportion of the poor living in urban areas is undoubtedly increasing, it remains true that virtually all aspects of poverty are generally worse in rural areas of LDCs.”

Poverty was largely seen as a rural phenomenon. However, today both in LDCs and middle-income countries, poverty is more pronounced in urban areas. This has been observed in our analysis too. While the poverty in rural areas has decreased by 5.6%, in urban areas, it has only decreased by 1.1%. In states like Bihar, Haryana, Uttarakhand, Uttar Pradesh and West Bengal, the number of people living under the poverty lines are higher in urban areas than in rural areas. One reason for the significant reduction of poverty in rural areas is the safety net created by several schemes, be it Ujjwala or something like Pradhan Mantri Gareeb Kalyan Yojana. But, the rising poverty in urban areas is concerning and urban-centric interventions are needed in especially these states to address the poverty challenge.
Bibek Debroy is Chairman, EAC-PM; Sarvadanand Barnwal is Joint Director, EAC-PM; and, Aditya Sinha is Additional Private Secretary (Research), EAC-PM. The views expressed in this article are those of the author and do not represent the stand of this publication.
Read all the Latest News , Breaking News , watch Top Videos and Live TV here.





Comments
0 comment