
There has been a surge in newcomers entering the stock market in recent years. Unfortunately, many individuals dive into investing without acquiring adequate knowledge about how the stock market functions. They end up exiting the market after suffering losses. For those genuinely seeking to profit from the stock market, learning is a necessity. The stock market is akin to an ocean in its depth, offering a plethora of learning opportunities. With various investment instruments available like equities, futures and options, mutual funds, bonds, and more, it’s natural to wonder where to start the learning journey from and what the fundamentals entail.
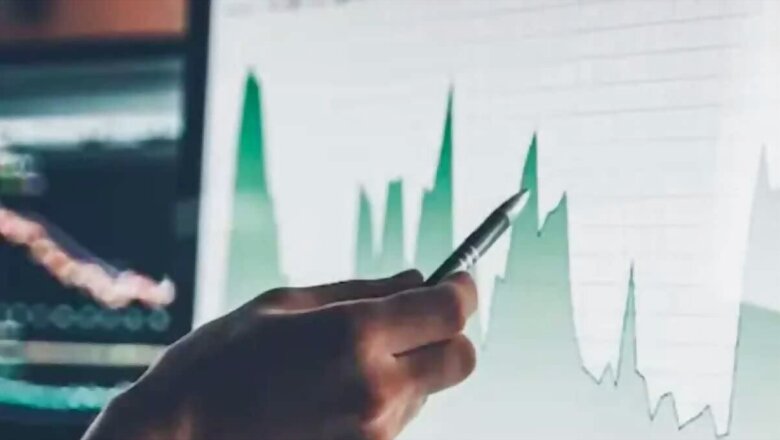
The first step to understanding the stock market is to learn to understand the price of a share. The most important thing to understand is the price is candlestick. A candlestick contains a complete description of the price for a specified period of time.
A candlestick chart serves as a visual representation of an asset’s price movements. It stands as one of the most renowned methods of technical analysis, widely embraced by traders for its ability to swiftly convey price data with just a glance at a few price bars.
The open, high, low, and close prices of any underlying (share or index) are displayed on a candlestick. Upon formation, a candlestick is often separated into two sections: the actual body and the shadow. Some refer to Shadow as Wick as well. The gap between the starting and closing prices is known as the real body, and the wick stands for price rejection. Price rejection can occur in both upward and downward directions.
In olden times, when there were no computers and calculators, traders faced a lot of difficulty in understanding the prices. At that time, Japanese rice traders created the candlestick method to understand the past and present prices at a glance. It is said that Munehisa Homma, a rice trader, invented it in the 18th century. A candlestick was formed on each day’s trading and by adding one candlestick after another, a long-term price could be seen at a glance, which is also called a Japanese candlestick chart or K-Line.
In 1991, Steve Nisson authored a book on the Japanese candlestick charting technique, introducing Western countries to this technology. Subsequently, candlestick patterns became widely adopted for tracking various market sentiments. The advent of candlestick charts simplified the process of understanding and monitoring sentiment, eliminating the need to sift through traditional ledgers to identify price fluctuations and market trends. Overall, if you are taking the first step towards tackling the stock market, then learn to read candlesticks


Comments
0 comment